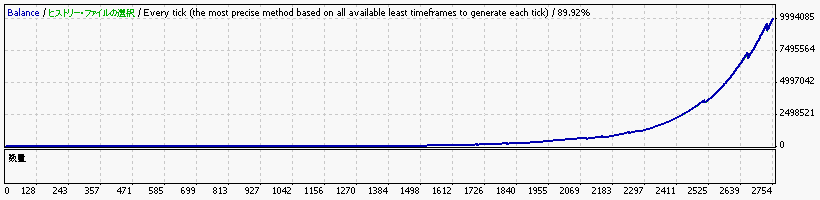
Strategy Tester Report
BN328 for EURUSD on ODL
ODL-MT4 Demo (Build 215)
| 通貨ペア | EURUSD (Euro vs US Dollar) | ||||
| 期間 | 30分足(M30) 1999.01.06 14:30 - 2007.12.30 23:30 (1999.01.01 - 2007.12.31) | ||||
| モデル | Every tick (the most precise method based on all available least timeframes) | ||||
| パラメーター | MoneyManagement=true; minLots=0.1; maxLots=10000; Risk_percent=10; Magic=20080328; | ||||
| Bars in test | 111811 | Ticks modelled | 15823398 | Modelling quality | 89.92% |
| Mismatched charts errors | 0 | ||||
| Initial deposit | 1000.00 | ||||
| Total net profit | 10007361.70 | Gross profit | 11768613.70 | Gross loss | -1761252.00 |
| Profit factor | 6.68 | Expected payoff | 3639.04 | ||
| Absolute drawdown | 123.70 | Maximal drawdown | 614208.00 (6.36%) | Relative drawdown | 25.26% (296.20) |
| Total trades | 2750 | Short positions (won %) | 1323 (97.73%) | Long positions (won %) | 1427 (97.76%) |
| Profit trades (% of total) | 2688 (97.75%) | Loss trades (% of total) | 62 (2.25%) | ||
| Largest | profit trade | 49795.00 | loss trade | -567150.00 | |
| Average | profit trade | 4378.20 | loss trade | -28407.29 | |
| Maximum | consecutive wins (profit in money) | 248 (31606.50) | consecutive losses (loss in money) | 3 (-7343.10) | |
| Maximal | consecutive profit (count of wins) | 3910659.60 (155) | consecutive loss (count of losses) | -567150.00 (1) | |
| Average | consecutive wins | 58 | consecutive losses | 1 | |