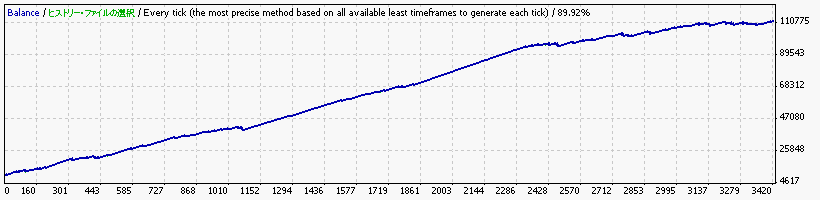
Strategy Tester Report
BN323sp for USDJPY
FXDD-MT4 Demo Server (Build 216)
| 通貨ペア | USDJPY (United States Dollar vs. Japanese Yen) | ||||
| 期間 | 30分足(M30) 1999.01.06 14:00 - 2007.12.29 00:30 (1999.01.01 - 2007.12.31) | ||||
| モデル | Every tick (the most precise method based on all available least timeframes) | ||||
| パラメーター | TakeProfit=5; StopLoss=60; Slippage=0; EntryHour=22; Fitted_to_ODL=true; EntryFrequency=1; MoneyManagement=false; minLots=1; maxLots=100; Risk_percent=10; Magic=20080323; | ||||
| Bars in test | 111105 | Ticks modelled | 16534396 | Modelling quality | 89.92% |
| Mismatched charts errors | 0 | ||||
| Initial deposit | 10000.00 | ||||
| Total net profit | 101694.03 | Gross profit | 159431.02 | Gross loss | -57736.99 |
| Profit factor | 2.76 | Expected payoff | 29.77 | ||
| Absolute drawdown | 302.26 | Maximal drawdown | 2774.75 (2.67%) | Relative drawdown | 11.76% (1549.19) |
| Total trades | 3416 | Short positions (won %) | 1720 (96.40%) | Long positions (won %) | 1696 (97.17%) |
| Profit trades (% of total) | 3306 (96.78%) | Loss trades (% of total) | 110 (3.22%) | ||
| Largest | profit trade | 99.97 | loss trade | -581.21 | |
| Average | profit trade | 48.22 | loss trade | -524.88 | |
| Maximum | consecutive wins (profit in money) | 495 (25455.66) | consecutive losses (loss in money) | 3 (-1533.90) | |
| Maximal | consecutive profit (count of wins) | 25455.66 (495) | consecutive loss (count of losses) | -1533.90 (3) | |
| Average | consecutive wins | 37 | consecutive losses | 1 | |