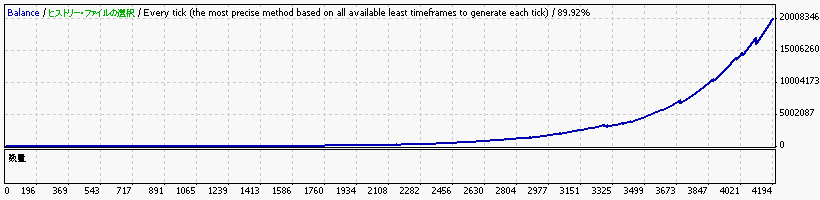
Strategy Tester Report
BN328 for EURUSD on ODL
ODL-MT4 Demo (Build 215)
| 通貨ペア | EURUSD (Euro vs US Dollar) | ||||
| 期間 | 30分足(M30) 1999.01.06 14:30 - 2007.12.30 23:30 (1999.01.01 - 2007.12.31) | ||||
| モデル | Every tick (the most precise method based on all available least timeframes) | ||||
| パラメーター | MoneyManagement=true; minLots=0.1; maxLots=10000; Risk_percent=5; Magic=20080328; | ||||
| Bars in test | 111811 | Ticks modelled | 15823398 | Modelling quality | 89.92% |
| Mismatched charts errors | 0 | ||||
| Initial deposit | 10000.00 | ||||
| Total net profit | 20027625.80 | Gross profit | 24110406.90 | Gross loss | -4082781.10 |
| Profit factor | 5.91 | Expected payoff | 4781.00 | ||
| Absolute drawdown | 618.50 | Maximal drawdown | 1056512.00 (6.17%) | Relative drawdown | 13.63% (1481.00) |
| Total trades | 4189 | Short positions (won %) | 1988 (97.99%) | Long positions (won %) | 2201 (98.05%) |
| Profit trades (% of total) | 4106 (98.02%) | Loss trades (% of total) | 83 (1.98%) | ||
| Largest | profit trade | 49970.00 | loss trade | -511740.00 | |
| Average | profit trade | 5871.99 | loss trade | -49190.13 | |
| Maximum | consecutive wins (profit in money) | 248 (33403.90) | consecutive losses (loss in money) | 3 (-6208.80) | |
| Maximal | consecutive profit (count of wins) | 3970707.20 (90) | consecutive loss (count of losses) | -990480.00 (2) | |
| Average | consecutive wins | 65 | consecutive losses | 1 | |